
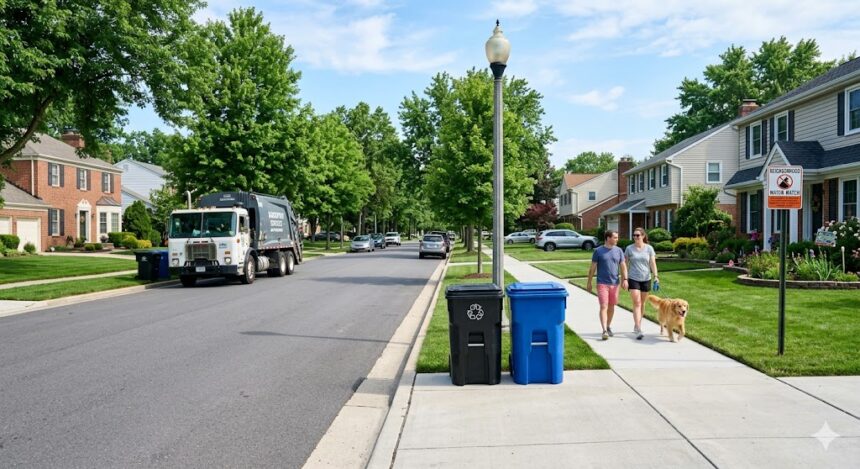
The idea of walking through pristine neighborhoods in the United States seems, for many, like a distant dream. Complaints about sidewalks flooded with plastic, cigarette butts, and fast-food packaging are part of daily life in neighborhood chats. However, the latest data has just shaken up public policy and environmental boards with a figure few saw coming. A historic national report reveals that the amount of litter on U.S. streets has decreased by 34%.
- The new waste map: What does the study say exactly?
- A breakdown of litter: Waste that’s decreasing vs. waste that’s surging
- Comparative table of waste trends on public roads (2020-2026)
- The hidden nightmare: The crisis in coastal areas
- Why is litter decreasing in neighborhoods?
- The economic cost of what’s still on the ground
Yes, the drop is real and measurable, but the truth behind this statistical relief is far more complex than it appears at first glance. While some waste disappears, the new era of e-commerce and consumption habits is flooding our communities with a different kind of trash that traditional recycling trucks can’t keep up with.

The new waste map: What does the study say exactly?
The data comes from the 2026 National Litter Study published by Keep America Beautiful (KAB). This scientific report analyzes the volume, composition, and sources of waste along highways, rivers, and public areas across the country, comparing it directly with metrics obtained before the start of the decade.
The major conclusion is that the litter rate per person on public roads and waterways fell from 152 pieces to 96 items per person.
Here’s the interesting part. The decline hasn’t been uniform, nor has it affected all products equally. The transformation of our daily routines over the past five years has completely reshaped what ends up discarded on sidewalks.
A breakdown of litter: Waste that’s decreasing vs. waste that’s surging
To understand where our community is headed, we need to look at what we buy and what we throw away. The overall 34% drop is driven by massive declines in categories that were once a nightmare for municipalities, but the rise in others is setting off alarms for local waste collectors.

- Personal Protective Equipment (PPE): Masks and surgical gloves that flooded corners and sewers during the health crisis saw a 76% decrease. Essentially, they’ve disappeared from the usual landscape.
- The plastic effect: While plastic in general shows a downward trend due to local restrictions on single-use bags in states like California and New York, plastic water bottles increased by 20% in field measurements.
- The e-commerce boom: The most drastic change is seen in cardboard. Cardboard boxes and packaging waste surged by 50%, driven by the culture of home delivery and online shopping that isn’t properly disposed of in recycling bins.
- Vapes on sidewalks: Remnants of e-cigarettes and vape cartridges show steep growth curves, becoming the new enemy of urban water filtration systems.
Comparative table of waste trends on public roads (2020-2026)
| Type of Urban Waste | Percentage Trend | Impact on the Community and Local Infrastructure |
| Masks and gloves (PPE) | 76% decrease | Immediate relief for manual collection systems. |
| Cardboard packaging | 50% increase | Overloaded residential bins; visual obstruction. |
| Plastic water bottles | 20% increase | Clogged storm drains and increased microplastics. |
| Litter on major highways | 22% reduction | Lower direct spending on state highway cleanup. |
| Waste in rivers and waterways | 45% reduction | Improved surface water quality and local ecosystems. |
The hidden nightmare: The crisis in coastal areas
This is where the report stops being a celebration and turns into an uncomfortable warning. For the first time in the country’s history, the study included a specific estimate of litter density in coastal areas and public-access beaches. The results are alarming.
“Coastal areas in the United States contain between 8 and 13 times more litter per mile than inland environments.”
This means that while major highways appear cleaner thanks to maintenance crews and traffic fines, litter accumulated along coastlines—where tourism and ocean currents converge—remains out of control. In these hotspots, traditional cigarette butts still account for nearly 38% of collected items, followed closely by fast-food packaging (25%).
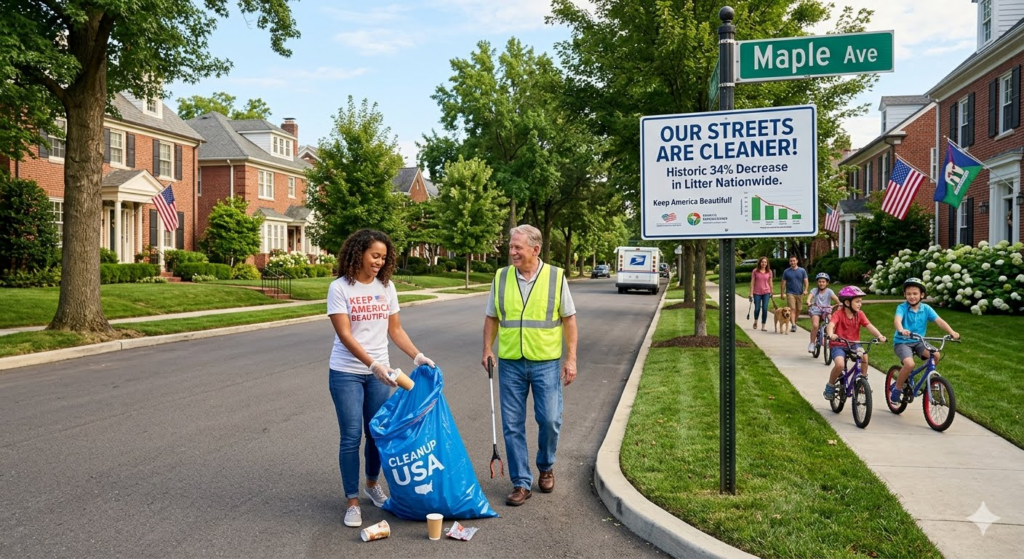
Why is litter decreasing in neighborhoods?
The reduction in street litter across the U.S. didn’t happen by magic or a sudden surge of collective awareness. It’s the result of three structural factors that local governments have strongly implemented:

- Infrastructure modernization: The installation of sealed bins with pest-proof technology and strict collection schedules. Major cities reduced the hours trash bags can remain on the curb before pickup, preventing animals or wind from scattering waste.
- Deposit laws and incentives: States with so-called Bottle Bills (laws that refund 5 to 10 cents for returning cans and bottles) report up to 15% less beverage container pollution in public spaces.
- Community pressure and volunteering: Local organizations and neighborhood committees have taken charge of cleaning their parks. In the past year alone, community cleanup programs mobilized millions of people, removing tons of debris from family recreational areas.
The economic cost of what’s still on the ground
Despite the improvement, the job isn’t done. In total, an estimated 35 billion pieces of litter remain scattered across the country. Keeping cities even moderately livable comes at a steep price, paid directly by residents’ taxes.
The annual cost to clean towns and highways exceeds $11.5 billion, with nearly $830 million spent exclusively on highways. Additionally, litter buildup in sewer systems isn’t just an aesthetic problem: it clogs up to 30% of urban storm drains, resulting in millions of dollars in losses from minor flooding during heavy rain seasons in vulnerable states like Florida’s coast.
The truth is that a 34% drop is a huge step, but statistics don’t clean the front of your home. Real change will take hold when the shift toward sustainable packaging and individual responsibility stops being a brochure topic and becomes the norm in our neighborhoods.
Image: ElHispanoParaTodos/PRESS