

Record Prices in the U.S.: How Much Longer Can Your Wallet Hold Out?
Translated with AI from the original article in Spanish. Leer la noticia original en español

The U.S. consumer's wallet has shown unusual resilience over the last few years. But macroeconomic data and behavior at points of sale indicate that this buffer capacity has entered a critical phase of exhaustion.
The four factors exhausting the margin for maneuver
- Depletion of accumulated savings. The financial cushion generated by fiscal transfers and lower consumption during 2020-2021 has practically dissipated for middle- and low-income deciles. The personal savings rate remains persistently below its pre-pandemic historical averages (hovering between 3% and 4%).
- Record consumer debt and cost of credit. As liquid savings evaporate, families have turned to credit to maintain their basic spending level:
- Credit cards: Total credit card debt exceeds $1.1 trillion, with average annual percentage rates (APR) exceeding 21%.
- Delinquency: Payment delays (delinquency rates) of more than 30 and 90 days on credit cards and auto loans have reached levels not seen in over a decade.
- Use of "Buy Now, Pay Later" (BNPL): The use of short-term micro-loans for grocery shopping and essential products has multiplied, hiding debt that often does not immediately enter traditional credit reports.
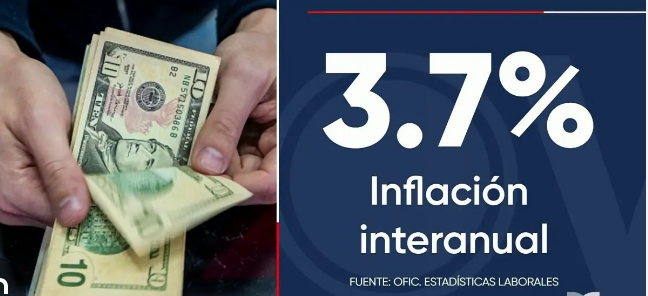
- Non-negotiable expenses out of control. Although the general inflation rate has shown occasional slowdowns compared to its peaks, the problem lies in the cumulative effect of rigid goods and services:
- Housing and rent: Absorbs more than 35% to 45% of working families' income.
- Insurance (home and auto): Double-digit year-over-year increases, especially pronounced in coastal regions and states with high climate exposure like Florida.
- Food and energy: The basic basket has accumulated an increase of more than 25% compared to 2020 levels, reducing the margin available for any unforeseen event.
- The bifurcated economy (Two-speed consumption). There is a marked gap between strata:
- High-income households: Benefit from high returns on fixed income, stock market appreciation, and capital gains on housing with low fixed mortgages (3%). They continue to spend on leisure and premium services.
- Middle- and low-income households: Depend exclusively on their nominal salary, which has lost ground against cumulative prices, and have no assets to neutralize inflation.
Behavioral changes on the street
| Behavioral indicator | Observed trend |
| "Trading down" | Mass migration toward store brands and discount chains (Walmart, Aldi, Dollar General). |
| Discretionary spending | Cutbacks in visits to traditional restaurants, leisure outside the home, and deferred purchases of durable goods (furniture, appliances). |
| Purchase frequency | More frequent store visits but with smaller basket volumes (contained average ticket). |
How much longer can they hold out?
The resistance will not break through a sudden general halt, but rather through a gradual and fragmented cooling conditioned by two decisive factors:
- The labor market: As long as the unemployment rate remains relatively low, the flow of income will continue to support minimum consumption, avoiding an abrupt contraction of GDP.
- Federal Reserve monetary policy: If the cost of money remains restrictive for a longer period, debt refinancing will choke the cash flow of more households, forcing a direct cut in sales volume over the coming quarters.
Key points for immediate monitoring
- Review of the core PCE and CPI index: Confirm whether the services and housing component remains rigid.
- Quarterly reports from retail chains: Measure whether customer traffic continues to substitute leading brands for generic ones.
- Consumer credit default rates: Evaluate whether loss provisions at regional banks are increasing in the automotive and credit card segments.
Get our news on Google⭐ Add El Hispano as a preferred source on Google